In a highly competitive and ever-changing video streaming industry, it’s crucial to benchmark your performance against market leaders to stay ahead of the game. At JUMP, with 6 years of expertise in the field, we understand the importance of market benchmarking and have compiled the Video Streaming Optimization Index (VSOI) to help you evaluate your performance and make data-driven decisions for growth.
The VSOI contains key performance metrics for Top Performers, Mid Performers, and Low Performers in the video streaming industry, including retention, customer satisfaction, and engagement. By comparing your metrics to the benchmark values in the VSOI, you can identify areas for improvement and make informed choices for your business’s future.
Stay up-to-date with the latest industry trends, set achievable goals, and track your progress toward growth with the VSOI. We invite the entire video streaming industry to contribute to and refine these benchmark values, making them increasingly useful for everyone.
We would love to hear your thoughts on the VSOI. Contact us to schedule a FREE WORKSHOP and see which metrics you have the potential to improve and how to optimize them. Let’s work together to make your video service a top performer in the industry.
Maximizing Your Video Service’s Potential: The Importance of Market Benchmarking
As experts in the video streaming industry, we strongly advise you to have a market benchmark for your video service’s most important business metrics. Here’s why:
- Competition: The video streaming industry is highly competitive and continuously changing. By comparing your performance to market leaders, you can see how you measure up and find areas for improvement.
- Industry trends: Keeping track of your competitor’s key metrics allows you to stay up-to-date with the latest industry trends and adjust your strategy accordingly.
- Business growth: Benchmarking helps you set achievable goals and track your progress toward growth. It allows you to evaluate the impact of your decisions and make informed choices for your business’s future based on data.
- Customer satisfaction: Metrics such as retention, customer satisfaction, and engagement give valuable insights into how well your service appeals to your audience. Comparing your performance to industry leaders helps you understand how to enhance these metrics and provide a better experience for your customers.
- Maximize the value of your converted subscribers by implementing a personalized experience strategy utilizing machine learning algorithms. This approach not only enhances their experience but also promotes the discovery of new content tailored to their viewing history and preferences, resulting in increased retention of your newly converted subscribers in their new package.
Throughout JUMP’s 6 years of existence, our clients have often asked us how they can compare their video streaming performance with market benchmarks.
Based on our experience over the years of helping video streaming services become data-driven entertainment experiences, which has involved not only measuring many of these performance metrics but also assisting our clients in optimizing them, we have compiled the values we consider to be metrics of Top Performers, Mid Performers, and Low Performers.
While it is not an easy task because video streaming services are heterogeneous, operate in different markets, and serve different verticals, we wanted to start a journey that we hope will be shared with the rest of the industry and create a reference framework for everyone to follow. This is just the first step in that direction, and we are sure that there are KPIs missing, others whose benchmark values will generate debate, etc. But that’s exactly the idea! To generate interaction and invite the entire industry to contribute its expertise and knowledge to refine these data and make them increasingly useful for everyone.
In any case, here is the first iteration of this journey that we share with much love and enthusiasm. Please welcome the JUMP Video streaming optimization index (VSOI) to Maximize your Video Service’s potential!
Acquisition Metrics

These metrics focus on attracting and acquiring new subscribers for the video streaming service: The New Subscriber Acquisition Rate measures the rate at which new subscribers are added.
- The Subscriber Acquisition Cost (SAC) measures the cost of acquiring each new subscriber

- The Conversion Rate measures the rate at which visitors convert into subscribers. *The rate at which visitors to the video streaming service convert into subscribers.
- Trial Conversion Rate measures the rate at which trial users become paid subscribers *The rate at which trial users of the video streaming service convert into paid subscribers.
- The Win-Back Ratio measures the proportion of subscribers who have cancelled and then re-subscribed. *The ratio of users who have canceled their subscription and then re-subscribed, compared to the total number of canceled subscribers.

Acquisition Metrics Trial Conversion Rate High Performance > 50% Medium Performance 30-50% Low Performance < 30%
Win-Back Ratio High Performance > 30% Medium Performance 20-30% Low Performance < 20%
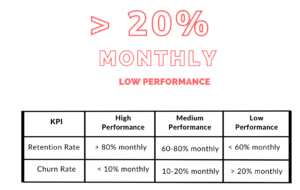
- The Retention Rate measures the percentage of subscribers who remain from one month to the next, with a high performance target of > 80% monthly.

- On the other hand, the Churn Rate measures the percentage of subscribers who cancel their subscriptions, with a low performance target of > 20% monthly.

Engagement Metrics
These metrics focus on user engagement with the video streaming service.
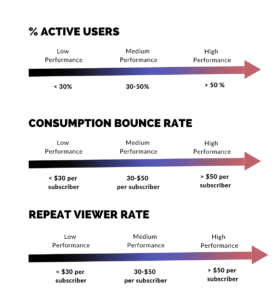
- The % Active Users measures the percentage of unique users who engage with the service, with a high performance target of > 50%.
- The Consumption Bounce Rate measures the percentage of users who leave the service after only viewing one page without consuming any video content, with a low performance target of > 50%.
- The Repeat Viewer Rate measures the percentage of users who watch at least one video more than once, with a high performance target of > 30%.

Consumption Metrics
These metrics focus on how users interact with and consume the video content.
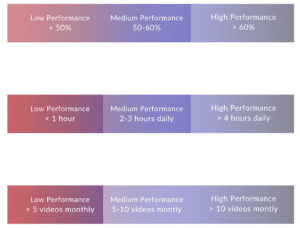
- The Average Session Length measures the average amount of time spent by a user on the service during a single session, with a high performance target of > 30 minutes.
- The Video Completion Rate measures the percentage of users who complete a video, with a high performance target of > 70%. +
- The % of Total Views from Recommendations measures the proportion of views that come from content recommendations, with a high performance target of > 50%.

- Content Utilization Rate: Measures the percentage of the video streaming service’s available content that is being consumed by users.
- Average Viewing Time: Measures the average amount of time spent by a user watching content on the video streaming service.
- The Win-Back Ratio: Measures the average number of videos watched by a user on the video streaming service in a given month.

Monetization Metrics
These metrics focus on the revenue generated by the video streaming service.
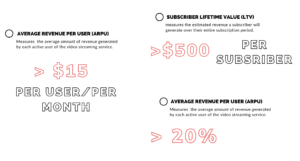
- The Average Revenue per User (ARPU) measures the average amount of revenue generated by each active user, with a high performance target of > $15 per user per month.
- The Subscriber Lifetime Value (LTV) measures the estimated revenue a subscriber will generate over their entire subscription period, with a high performance target of > $500 per subscriber.
- The Revenue Growth % measures the increase or decrease in revenue compared to the previous period, with a high performance target of > 20%.

These metrics are crucial to understanding the financial performance of the video streaming service and the return on investment for acquiring and retaining subscribers.
We would love to hear your thoughts on the VSOI. Contact us to schedule a FREE WORKSHOP and see which metrics you have the potential to improve and how to optimize them. Let’s work together to make your video service a top performer in the industry.
Don’t wait any longer, take action NOW

Silvia Werd. Marketing Director
LinkedIn: www.linkedin.com/in/silviawerdelias

